Fingerprints
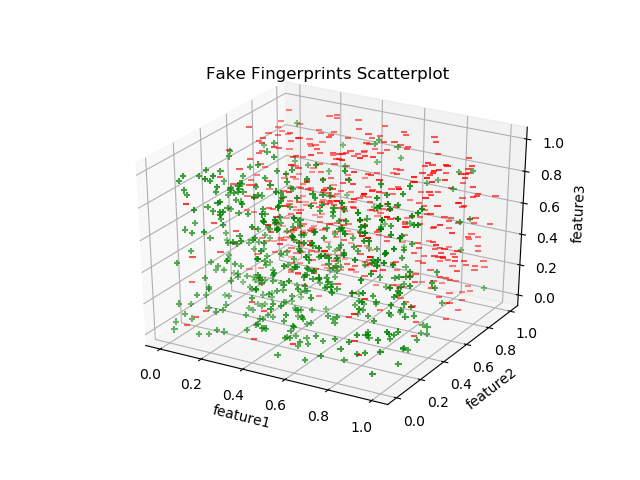
A supermarket chain has installed fingerprint readers at all of its locations. Your company has been hired by the supermarket chain to implement a machine learning system that recognizes participants in their membership program by their fingerprints. They have provided you with a sample data set of 100 training instances labeled with 1s for people in the program and 0s for people who aren’t in the program. A scatter plot of the data looks like this:

The CIA has also hired your company to implement a machine learning system that identifies people who should be granted access based on their fingerprints. The CIA has provided you with a data set and, amazingly, it is identical to the supermarket’s data set!
As a data scientist in the company you have been tasked with creating machine learning models for both customers.
Part 1: Risk Matrix
Naturally, the CIA and supermarket chain have different tolerances for false positives and false negatives which happens to correspond exactly to the values in Example 1.1 on Page 29 of Learning from Data. Do Problem 3.16 in Learning from Data.
Hints:
-
Probaility of accepting is . Since this is a probability:
- , and
- the probability of rejecting is .
- Expected cost is the probability of occurrence multiplied by the cost.
- Total cost of accepting (returning +1) is the cost of true positive + the cost of a false positive.
- Total cost of rejecting (returning -1) is the cost of false negative + the cost of a true negative.
Part 2: Logistic Regression Classification
-
Train a binary logistic regression classifier on the data set.
-
Test your classifier using a classification threshold of 0.5.
-
Test your classifier using the probability thresholds you derived in Part 1 for the supermarket.
-
Test your classifier using the probability thresholds you derived in Part 1 for the CIA.
Notes
-
If you use Scikit-learn’s logistic regression you may need to hack the classification threshold yourself.
-
If you use Spark’s logistic regression classifier you can set a threshold parameter.
-
Fingerprint verification is hard. My original plan for this assignment was to have you use an actual fingerprint data set like SOCOFing but that would have been excessively hard for you. In real fingerprint verification problems you have multiple subjects – not just two classes (in or out), you have only a few images per class, and you have to extract features from images. So I created a fake data set by generating random feature vectors, finding two clusters, and then using the clusters as labels. You can see how in fake_fingerprints.py (I used Python because 3d plotting is much better supported in Matplotlib).
Report
Write a report containing your answer to Part 1 and the test results for the three scenarios in Part 2. This report should be in PDF format. You may find this template helpful (compiled PDF).
Your test results for Part 2 should include basic accuracy, confusion matrices and ROC curves. Include a brief discussion of your results. Don’t go overboard – you only need a few sentences to discuss the important points.
Turn-in Procedure
Submit your fingerprints.pdf file on Canvas as an attachment. When you’re ready, double-check that you have submitted and not just saved a draft.
Verify the Success of Your Submission to Canvas
Practice safe submission! Verify that your HW files were truly submitted correctly, the upload was successful, and that your program runs with no syntax or runtime errors. It is solely your responsibility to turn in your homework and practice this safe submission safeguard.
- After submitting the files to Canvas, return to the Assignment menu option and this homework. It should show the submitted files.
- Download copies of your submitted files from the Canvas Assignment page placing them in a new folder.
- Re-run and test the files you downloaded from Canvas to make sure it’s what you expect.
-
This procedure helps guard against a few things.
- It helps insure that you turn in the correct files.
- It helps you realize if you omit a file or files.\footnote{Missing files will not be given any credit, and non-compiling homework solutions will receive few to zero points. Also recall that late homework will not be accepted regardless of excuse. Treat the due date with respect. Do not wait until the last minute! (If you do discover that you omitted a file, submit all of your files again, not just the missing one.)
- Helps find syntax errors or runtime errors that you may have added after you last tested your code.